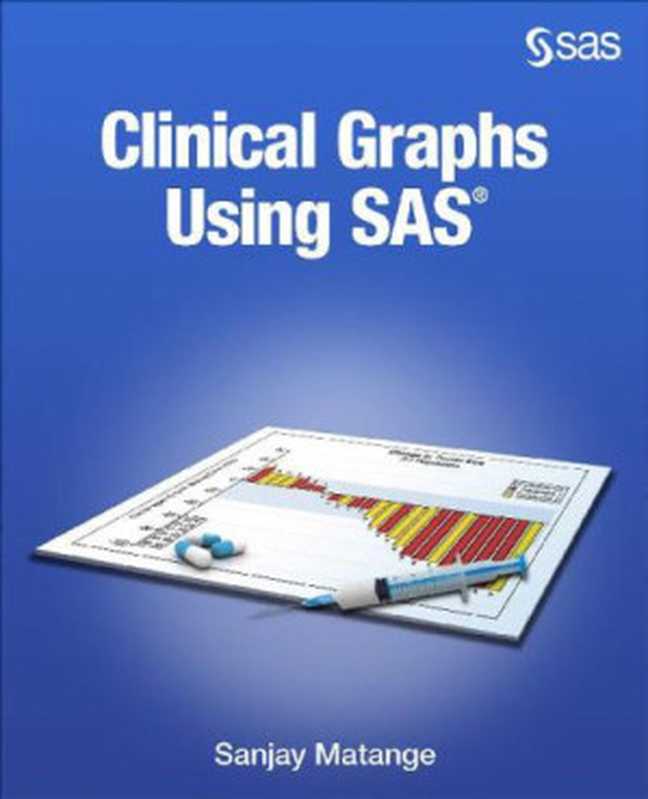
- 书名:Clinical Graphs Using SAS
- 出版社:SAS Institute
- 作者:Sanjay Matange
- 出版年份:2016
- 电子书格式: epub
- 简介:Master clinical data visualization with this comprehensive guide, “Clinical Graphs Using SAS” by Sanjay Matange. Learn to create effective and informative graphs using SAS software for clinical research and healthcare applications. This book covers various graphing techniques, from basic bar charts to complex statistical plots, enabling you to present your findings clearly and concisely. Ideal for researchers, healthcare professionals, and SAS programmers, this guide provides practical examples and clear explanations to enhance your data analysis and reporting skills. Improve your data storytelling and gain valuable insights with “Clinical Graphs Using SAS”.
- ISBN:9781629597010, 16295
- 下载地址(点击下载):
声明:本站所有文章,如无特殊说明或标注,均为本站原创发布。任何个人或组织,在未征得本站同意时,禁止复制、盗用、采集、发布本站内容到任何网站、书籍等各类媒体平台。如若本站内容侵犯了原著者的合法权益,可联系我们进行处理。

评论(0)